


Introduction to Detecting Diabetic Retinopathy with Machine Learning
Over the past decade, deep learning algorithms have greatly evolved. 2021 introduced large models like GPT-3 from OpenAI and GoPher from DeepMind, capable of performing billions of operations. However, they require extensive training time, often weeks, and can be costly and complex to configure. Furthermore, they can be slow during inference without GPUs. However, not all tasks require such large models for accuracy. Some, particularly within supervised learning, can use smaller yet effective models.
This article introduces EfficientNet, a smaller and faster model ideal for quick-result applications. It explains how EfficientNet operates and how it can be fine-tuned to detect early signs of Diabetic Retinopathy.
What is Diabetic Retinopathy?
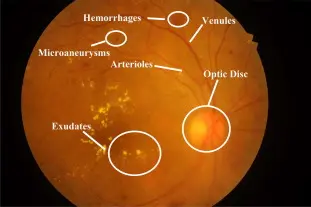
Diabetic Retinopathy, a leading cause of blindness or vision impairment, affects both type-1 and type-2 diabetes patients. Untreated diabetes can lead to diabetic retinopathy, which results from high blood sugar damaging the retina. The retina, located at the back of the eye, is composed of light-sensitive tissue that converts light into electrical signals. These signals are sent to the brain via the optic nerve to the visual cortex, which processes them into sight.
Retina functionality depends on a steady blood supply. In diabetes patients, the blood vessels carry high sugar levels, which over time can damage the retina and lead to vision loss. Often, retinopathy is only detectable through a retinal exam, as it typically has no noticeable impact on vision. Diabetic retinopathy can be prevented if it can be detected at the early stages of development. Once detected doctors can start appropriate treatment. This poses a challenge for doctors in identifying diabetic retinopathy before it progresses and causes irreversible issues.
What are the Diabetic Retinopathy Stages?
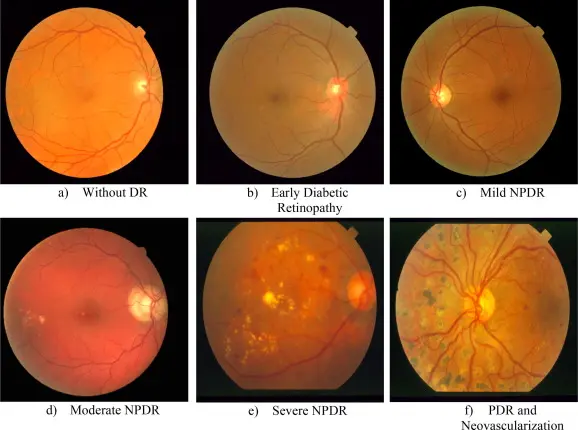
Diabetic retinopathy progresses through four stages:
Mild nonproliferative: Early stage with minor fluid leakage from tiny retinal vessel swellings, usually without vision impact.
Moderate nonproliferative: Progressed swelling of vessels hinders nourishing blood flow to the retina, potentially causing blurry vision.
Severe nonproliferative: Significant blockage in retinal blood vessels prompts fragile new vessels’ growth, causing swelling, blurry vision, dark spots, and possible vision loss.
Proliferative: Advanced stage with continual growth of fragile vessels leading to scar tissue, possibly causing retinal detachment, vision blurriness, and even permanent blindness.
What is EfficientNet?
EfficientNet is a family of Convolutional Neural Networks (CNN) which was introduced by Mingxing Tan and Quoc V. Le from Google Brain. The authors used neural architecture search (NAS) to design an appropriate baseline neural network for image classification. NAS uses techniques like search space, search strategy, and performance estimation strategy which allows it to automatically design a neural network from scratch given the appropriate data. Once NAS yields a baseline architecture it can then be scaled up using a method called compound scaling. EfficientNet and TransUNet are two distinct models used in computer vision tasks. EfficientNet is designed to balance depth, width, and resolution to achieve high performance while being computationally efficient, making it suitable for image classification. On the other hand, TransUNet combines UNet and Transformers to enhance image segmentation, particularly in medical imaging, by leveraging the power of Transformers to capture global context and long-range dependencies.
How does EfficientNet compare to other ML models?
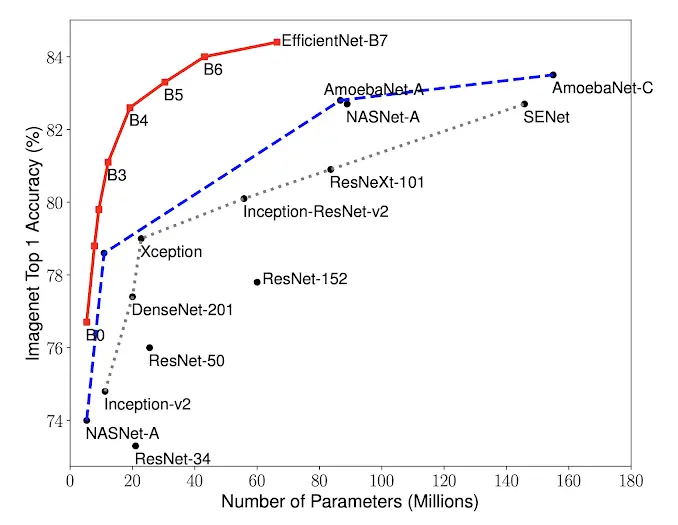
EfficientNet offers better performance compared to other state-of-the-art models due to its unique scaling methodology. By scaling up all dimensions of the network (depth, width, and resolution), EfficientNet ensures a balanced and efficient improvement in performance. In various benchmarks, EfficientNet has shown superior accuracy with fewer parameters and less computational complexity, outperforming larger models like ResNet and DenseNet. You can view the different models’ performance on the ImageNet dataset below. We also provide more statistics in the FAQ section.
What is Neural Architecture Search?
Before applying compound scaling, it’s essential to establish a baseline network. The researchers achieved this using a technique called Neural Architecture Search (NAS). This approach automatically designs the neural network.
A key element in the NAS method is the 'search space’. In essence, the search space defines the set of possible architectures that NAS can generate. This might include different building blocks or operations such as convolutions and pooling, or pre-established architectures that these operations are arranged into.
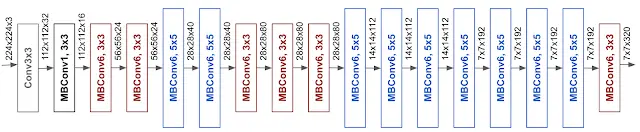
For EfficientNet, the search space was based on the MobileNet architecture, specifically the inverted residual structure. This choice served as the backbone or foundation for the networks created by NAS.
The resulting model from NAS then underwent compound scaling, a method of uniformly increasing the depth (the number of layers), width (the number of neurons per layer), and resolution (the size of the input) of the network. This carefully balanced scaling process resulted in a high-performance, computationally efficient network, thus giving birth to the EfficientNet family of models.
What is Compound Scaling?
Compound scaling, a key aspect of the EfficientNet model, involves a scaling factor to proportionally increase the depth, width, and resolution of the network. This scaling factor is known as a compound coefficient.
The depth of the network (αN), the width of the network (βN), and the image size (γN) are all scaled in accordance with this compound coefficient. In other words, the depth, width, and resolution of the network are all increased by a certain factor to ensure a balanced scale-up of the model.
The values of the constants α, β, and γ are determined through a grid search on the original, smaller model. A grid search is a method used to perform hyperparameter optimization, an important step in machine learning model building. In the case of EfficientNet, this grid search was used to find the most effective values for α, β, and γ, which then set the scaling factor for the network’s depth, width, and resolution.
So in a nutshell, compound scaling in EfficientNet involves a thoughtful scaling of the model’s architecture to maintain a balance between the network’s depth (number of layers), width (number of neurons per layer), and resolution (input size), which leads to a better performing, yet still computationally efficient, model.
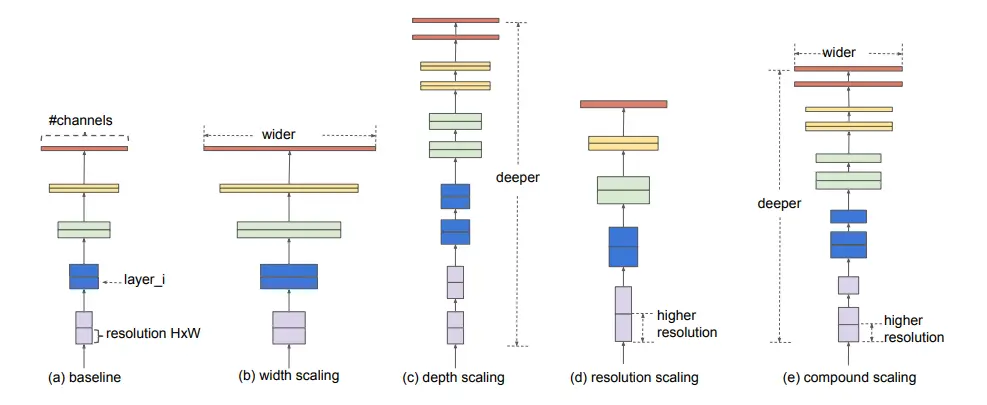
The image above shows the systematic study of how the model is scaled up. As you can see in the last image (e) the network finds a balanced relationship between the different scaling dimensions such as (a) baseline network, (b) width, © depth, and (d) resolution that can lead to better performance. This is known as the compound scaling method. The aim of this method is to uniformly scale the network in all dimensions to increase efficiency.
What is the Messidor Dataset?
The Messidor dataset, an acronym for “Methods to Evaluate Segmentation and Indexing Techniques in the field of Retinal Ophthalmology,” focuses on Diabetic Retinopathy, a condition that is often difficult to identify manually. Ophthalmologists require significant skill and time to detect it, which can cause delays and miscommunication in treatment.
Diabetic retinopathy is identified by the presence of lesions, often related to vascular abnormalities. The dataset offers two medical diagnoses:
- Retinopathy grade: Ranging from 0 (Normal) to 3 (More than 15 microaneurysms).
- Risk of macular edema: Ranging from 0 (No risk) to 2 (Shortest distance between the macula and hard exudates is equal to or less than one papilla diameter).
Given the high expense of the equipment needed and the urgent requirement in high-diabetes regions, like rural India, automated methods using machine learning techniques are essential. These techniques can handle tasks such as image classification, pattern recognition, segmentation, and object detection.
Practical Guide to Diabetic Retinopathy Detection
Now with all of the theory out of the way, let’s take a look at how to implement this model in practice. We will focus on image classification using the retinopathy dataset. The complete process is documented in this linked notebook, which can be modified based on your objectives. It should be noted that we ran multiple experiments with training this model on this dataset, and we achieved better results using this notebook. Both training and testing datasets are available from Activeloop.
Using Deep Lake for Healthcare Machine Learning Data
Deep Lake provides a vast range of publicly accessible healthcare datasets for machine learning and other domains and tasks, updated daily by engineers. Deep Lake is built to make ML data management easy, and is compatible with third-party libraries for preprocessing.
Data Loading
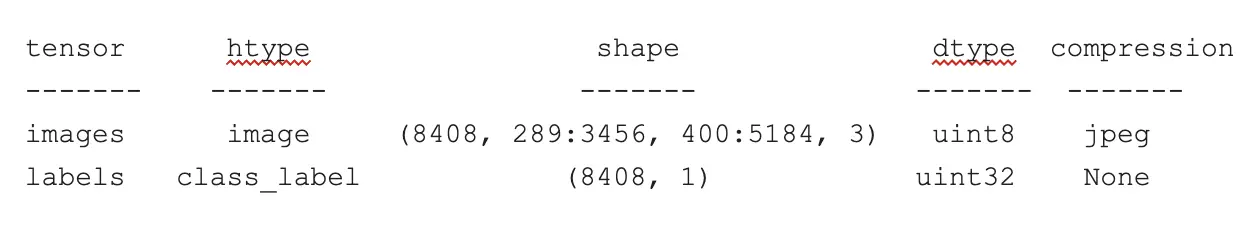
The deeplake library provides functionality for loading and interacting with large-scale datasets in an efficient manner. Here, we’re loading a Diabetic Retinopathy dataset hosted on Deep Lake. You do not need to create an API key to access this publicly hosted dataset.
1import deeplake
2
3ds = deeplake.load("hub://activeloop/messidor-diabetic-retinopathy")
4ds.summary()
5
6
The ds.summary() function provides a concise summary of the dataset, detailing the number of samples, and other relevant information.
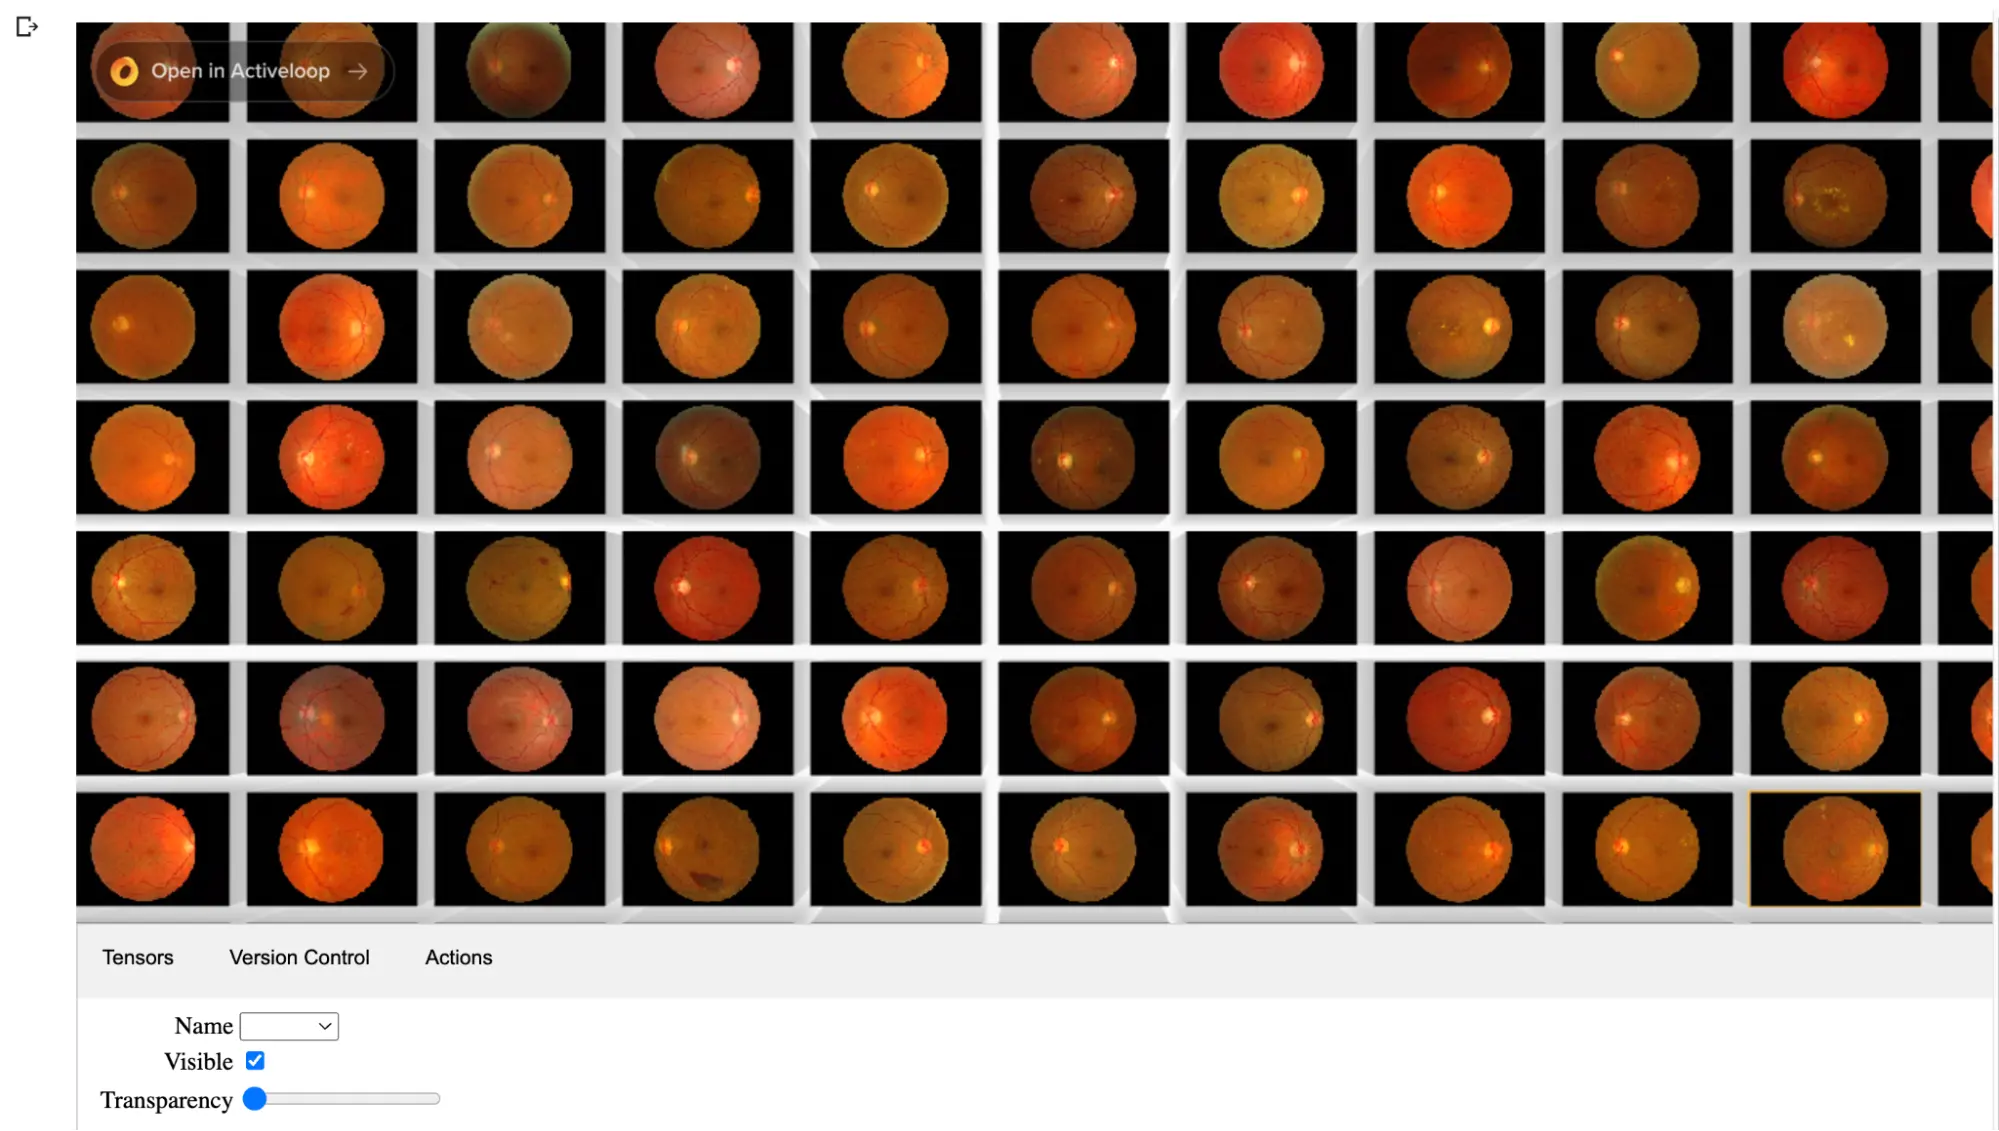
You can also run ds.visualize() to initiate a visualizer that lets you interact with the data.
Optional Data Exploration
Deep Lake provides an amazing feature that allows you to save your query and reuse it over and over again. This allows data uniformity across various users. For version control all you need to do is to follow these 4 steps:
- Run
- Save
- View
- Load
Run the query
This is where you execute the desired query in the UI.

Save the query
Once the query is executed click on Save query result to save the query.

View the query
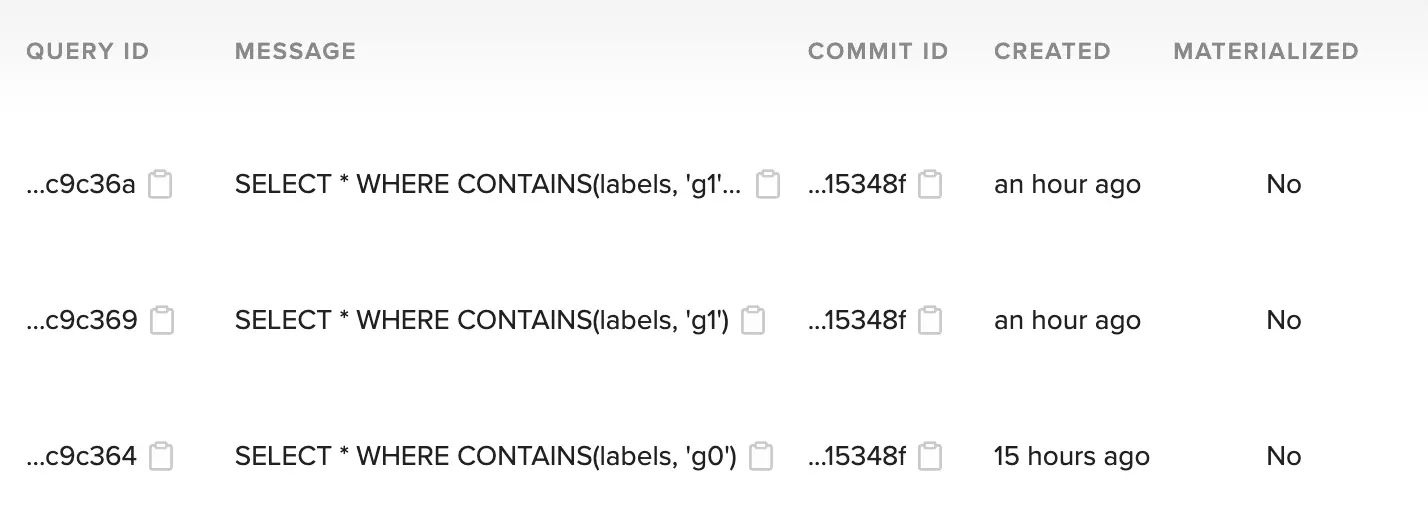
You can view the query results by clicking on the query history.

Load the query
You can then copy paste the query id in the load_view function as shown below to access the query, this is similar to what we saw earlier. Here we are using the hash for the first query commit.
ds.load_view('637cdeeb022d9e1237c9c364', optimize = True)
For more details you can check out this video: What is Deep Lake? Activeloop Deep Lake Product Demo.
Data Querying and Filtering
Data Querying is very simple. Since the dataset contains five different classes you can either use all the classes to train the model or constrain them to two, three, or even four classes. To query the dataset just mention the classes that you want to work with.
You can find the name of the classes by running this code:
1ds.labels.info['class_names']
2['g0', 'g3', 'g1', 'g2']
3
Deep Lakes allows you to perform querying and filtering using the Tensor Query Language (TQL) query method.
Using the TQL query method
1`g0 = ds.query("SELECT * WHERE CONTAINS(labels, 'g0')")`
2
The TQL query method can be further modified as well. Let’s say you want to first visualise the frequency of each class. And based upon the frequency you want to select the classes for training.
1class_names = ds.labels.info.class_names
2num_classes = len(class_names)
3class_count_raw = np.bincount(np.concatenate(ds.labels.numpy(aslist = True), axis=0))
4plt.bar(np.arange(num_classes), class_count_raw, tick_label = class_names)
5plt.xlabel('Grade', weight='bold')
6plt.xticks(rotation='horizontal')
7plt.ylabel('Number of Instances', weight='bold')
8plt.title('Occurance of grades', weight='bold')
9plt.show()
10
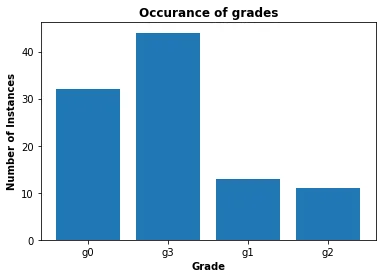
Let’s assume that we want to use grade 0 and grade 3 as they have greater frequency compared to the other two. But they are still imbalance. We can use the following code to essentially filter the data based upon the class weightage.
1balanced_view = ds.query("select * sample by max_weight(contains(labels, 'g0'): 7, contains(labels, 'g3'): 5, contains(labels, 'g1'): 10, contains(labels, 'g2'): 10)")
2class_count_balanced = np.bincount(np.concatenate(balanced_view.labels.numpy(aslist = True), axis=0))
3X_axis = np.arange(len(class_names))
4plt.figure(figsize=(8, 4))
5plt.bar(X_axis - 0.2, class_count_raw, 0.4, label = 'Raw Data')
6plt.bar(X_axis + 0.2, class_count_balanced, 0.4, label = 'Sampled Data')
7plt.xticks(X_axis, class_names)
8plt.xlabel('Condition', weight='bold')
9plt.xticks(rotation='vertical')
10plt.ylabel('Number of Instances', weight='bold')
11plt.title('Frequency per Condition', weight='bold')
12plt.legend()
13plt.show()
14
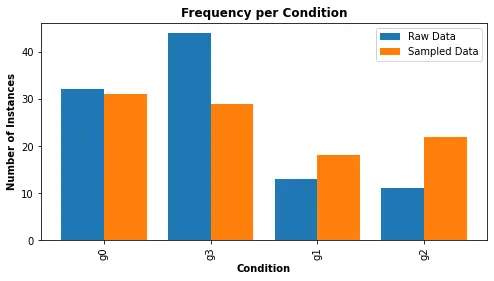
As you can see that grade g0 and g3 are almost balanced. Once you are satisfied we can then move forward and perform data transformation.
Saving the view
Once the view is finalized you can then save the view. Saving the view is an essential practice because then you can share view with your teammates and reuse it whenever you are reiterating the model. The following syntax will help you save the view:
1balanced_view.save_view(message = 'balanced_view')
2
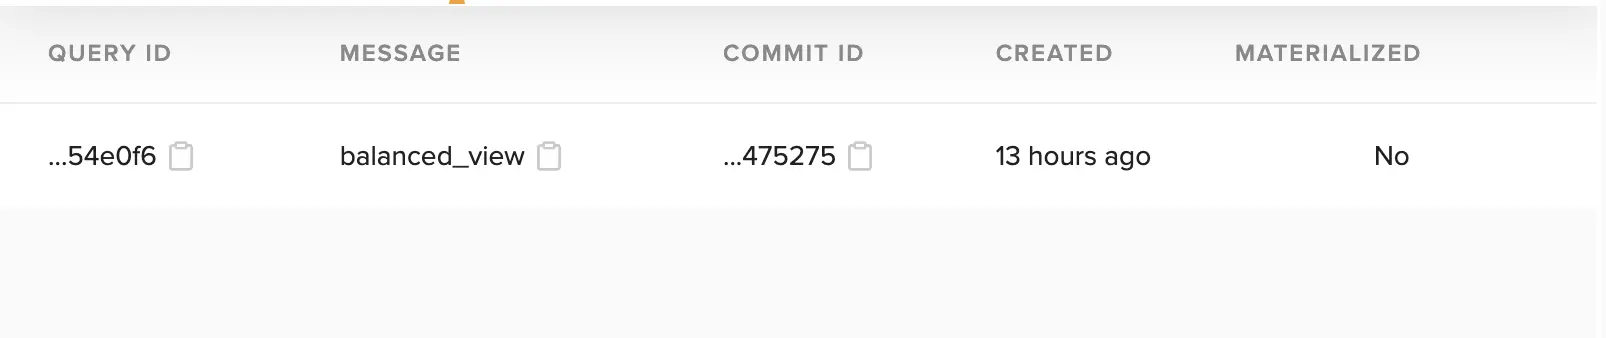
After the view is saved you can view it in the UI as well.
Loading the view
In order to download the view you can use the following syntax:
1new_view = ds.load_view('c1f647bf6eaa49c6258dac584a556bd3ec49b4f5c0ba588843f3840b3154e0f6', optimize = True) # hash comes from QUERY ID
2
Once downloaded, you can visualise the view using ds.visualize().
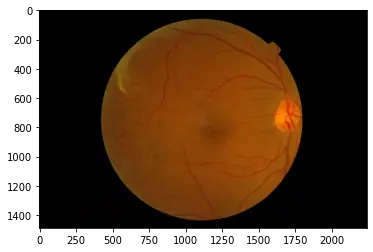
Image Transformations
Image transformations are an essential part of deep learning pipelines. They help to augment the data, introduce variability, and reduce overfitting. Here is a sample input image:
With albumentations, we specify a series of transformations that will be applied to our images.
1import albumentations as A
2from albumentations.pytorch import ToTensorV2
3from torchvision import datasets, transforms, models
4
5tform = A.Compose([
6 A.Rotate(limit=20, p=0.5), # Rotate the image within a range of ±20 degrees with a probability of 50%
7 A.Resize(224, 224), # Resize the image to 224x224 pixels
8 A.HorizontalFlip(p=0.5), # Flip the image horizontally with a probability of 50%
9 A.Normalize(mean=(0), std=(1)), # Normalize the image with mean=0 and std=1
10 ToTensorV2() # Convert the image from numpy array to PyTorch tensor
11])
12
Defining the Model - EfficientNet
We are using the EfficientNet model which is a powerful convolutional neural network for image classification tasks. In the line model._fc = nn.Linear(in_features=1280, out_features=5, bias=True), we replace the final layer of the pretrained EfficientNet model to match our number of classes (5). We then transfer the model to the designated device (GPU if available, else CPU) for computation.
1import torch
2from torch import nn
3from efficientnet_pytorch import EfficientNet
4
5device = torch.device("cuda:0" if torch.cuda.is_available() else "cpu")
6
7model = EfficientNet.from_pretrained("efficientnet-b0")
8model._fc = nn.Linear(in_features=1280, out_features=5, bias=True)
9model = model.to(device)
10
Loss Function, Optimizer, and Scheduler
We use the CrossEntropyLoss, a popular loss function for multi-class classification problems. The Adam optimizer is used as it adapts the learning rate for each weight individually and is generally more efficient. We also define a learning rate scheduler to decrease the learning rate as the training progresses to fine-tune the model.
1from torch.optim import Adam
2from torch.optim.lr_scheduler import StepLR
3import torchmetrics
4
5optimizer = Adam(model.parameters(), lr=0.01)
6scheduler = StepLR(optimizer, step_size=4, gamma=0.5)
7loss_fn = nn.CrossEntropyLoss()
8train_accuracy = torchmetrics.Accuracy(task="multiclass", num_classes=4).to(device)
9n_epochs = 2
10
Training EfficientNet for Healthcare ML task
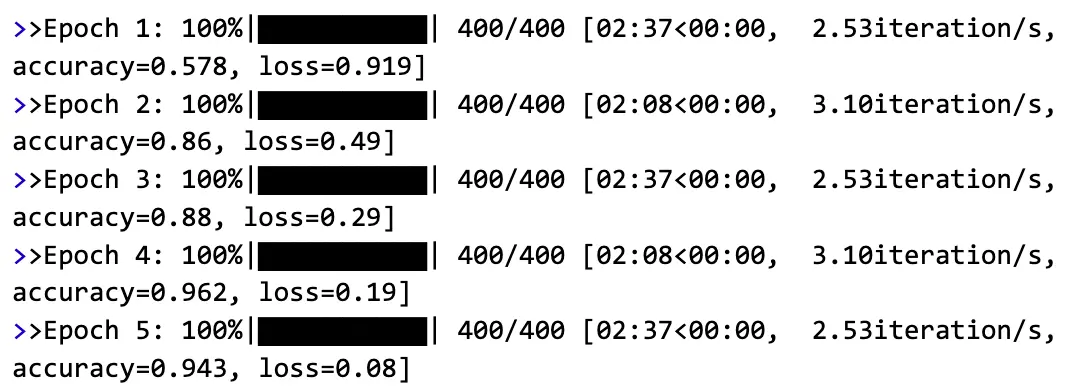
The model is trained using a standard PyTorch training loop. For each epoch, we load a batch of data, perform a forward pass through the model, calculate the loss, perform backpropagation to compute gradients, and then update the model parameters with the optimizer. We also compute the accuracy metric for monitoring purposes.
1from tqdm import tqdm
2
3for epoch in range(1, n_epochs + 1):
4 total_acc = 0
5 with tqdm(data_loader, unit="iteration") as train_epoch:
6 train_epoch.set_description(f"Epoch {epoch}")
7 for i, (data, target) in enumerate(train_epoch):
8 data = data.to(device)
9 target = target.to(device)
10
11 optimizer.zero_grad()
12 logits = model(data)
13 _, pred = torch.max(logits, dim=1)
14
15 loss = loss_fn(logits, target.squeeze(0))
16 loss.backward()
17 optimizer.step()
18 scheduler.step()
19
20 acc = train_accuracy(pred, target.squeeze(0))
21 total_acc += acc.item()
22 train_epoch.set_postfix(loss=loss.item(), accuracy=total_acc / (i + 1))
23
And here is the optimized model’s performance during training for each of the epochs:
Each of these steps contributes to creating an effective pipeline for diagnosing Diabetic Retinopathy. Careful configuration and tuning of these components can lead to high-performance models that can greatly aid in the medical diagnosis process.
Evaluating EfficientNet Performance in a Healthcare Machine Learning Task
Now let’s evaluate our model’s performance. We will be using the improved model trained in this notebook. We will evaluate the it on the following metrics AUROC, Confusion Matrix, and F1Score.
1from torchmetrics import AUROC, ConfusionMatrix, PrecisionRecallCurve,F1Score
2auc = AUROC('multiclass', num_classes=4)
3print(auc(pred, y).item())
4>> 0.79
5
6 This AUROC score is pretty good. How about its F1 score?
7f1 = F1Score(num_classes=5).to('cuda')
8f1(logits, y).item()
9>> 73.45
10
Let’s take a look at our model’s confusion matrix, or in other words which classes it confuses.
1import seaborn as sns
2cm = ConfusionMatrix('multiclass', num_classes=4).to('cuda')
3mat = cm(pred, y).detach().cpu().numpy()
4sns.heatmap(mat)
5
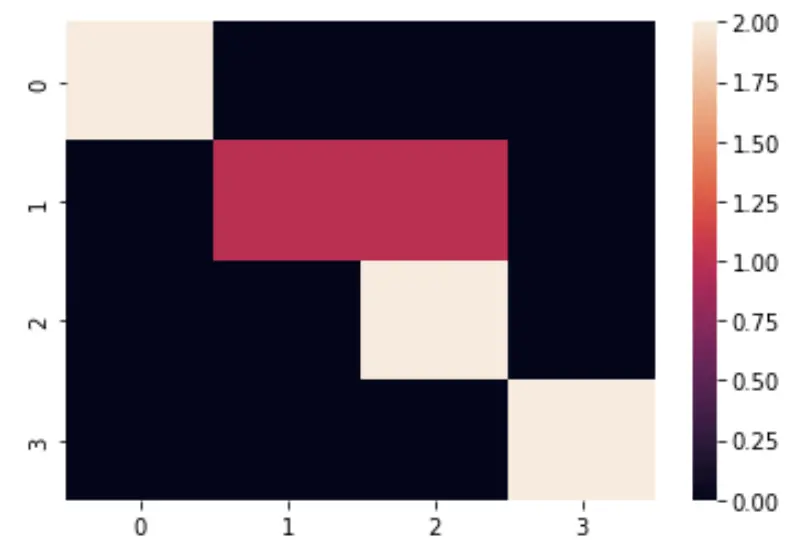
This is an example of confusion matrix in epoch 7. As you can see the model is able class correctly for the 1st, 3rd and 4th classes. The possible reason of why classes 1 and 2 confused is because the features of both classes are almost similar. This is quite normal in deep neural networks. To overcome this issue you can train it for a longer period of time.
Concluding remarks
In conclusion, this article has explored three key areas: Diabetic Retinopathy detection, EfficientNet, and the application of EfficientNet on the Messidor dataset. Diabetic retinopathy, a progressive eye disorder, often goes unnoticed until it begins to affect vision. It can be effectively managed with prompt diagnosis and proper treatment, but the current manual methods for diagnosis and screening are time-consuming and require substantial expertise.
EfficientNet, an advanced model architecture for image classification, was introduced as a solution. It balances depth, width, and resolution to provide optimal performance and computational efficiency.
We demonstrated how to train EfficientNet on the Messidor dataset to alleviate the burden of manual diabetic retinopathy diagnosis. These techniques significantly enhance the extraction of crucial information, particularly when dealing with limited data and computational resources. Automated systems, like those powered by AI and deep learning algorithms, play a crucial role in addressing the challenges associated with diabetic retinopathy diagnosis, underscoring the need for their wider adoption in the medical imaging sector.
Keep in mind that we trained and tested two implementations. This notebook is more comprehensive, but suffers from poor performance, while this notebook shows the performance were capable of achieving.
Frequently Asked Questions (FAQs) about AI in Healthcare
What are some EfficientNet benchmarks?
The table compares key parameters of several deep learning model families: ResNet, ResNeXt, SENet, NASNet, GPipe, DenseNet, Xception, and EfficientNet. Each is evaluated on accuracy and model complexity (Parameters in Million). Notably, GPipe presents the highest complexity with 556 million parameters and 84.3% accuracy. EfficientNet models, while more efficient in terms of parameters, manage to achieve comparable accuracy, with EfficientNet-B7 hitting 84.3% with 66 million parameters.
| Model | Accuracy | Parameters (Million) |
|---|---|---|
| ResNet-152 | 77.8% | 60 |
| ResNeXt-101 | 80.9% | 84 |
| SENet | 82.7% | 146 |
| NASNet-A | 82.7% | 89 |
| GPipe | 84.3% | 556 |
| DenseNet-201 | ~77% | ~20 |
| Xception | ~79% | ~20.1 |
| EfficientNet-B0 | ~77% | ~7 |
| EfficientNet-B1 | 79.1% | 7.8 |
| EfficientNet-B2 | ~81% | ~7.9 |
| EfficientNet-B3 | 81.6% | 12 |
| EfficientNet-B4 | 82.9% | 19 |
| EfficientNet-B5 | ~83% | ~38 |
| EfficientNet-B6 | ~84% | ~42 |
| EfficientNet-B7 | 84.3% | 66 |
How does EfficientNet detect early signs of Diabetic Retinopathy?
EfficientNet can be fine-tuned to detect early signs of Diabetic Retinopathy using the Messidor dataset. This dataset, which includes images of various stages of Diabetic Retinopathy, can be used to train the EfficientNet model to classify and identify the severity of the condition based on visible lesions in the retinal images.
What makes EfficientNet ideal for quick-result applications?
EfficientNet, due to its balanced scaling of depth, width, and resolution, offers high performance while being computationally efficient. This makes it ideal for quick-result applications where both speed and accuracy are crucial.
How does EfficientNet use the Neural Architecture Search (NAS) method?
EfficientNet uses NAS to establish a baseline network. The search space for EfficientNet is based on the MobileNet architecture, and NAS generates a variety of architectures within this search space. The model that performs the best is selected as the baseline for EfficientNet, which then undergoes compound scaling.
How does EfficientNet’s performance compare to other state-of-the-art models?
Benchmarks show EfficientNet achieves better accuracy than larger models like ResNet and DenseNet with fewer parameters. Its unique scaling method improves performance efficiently.
How does neural architecture search help create an optimal model?
Neural architecture search automates finding the best model design for a task. For EfficientNet, it provided a strong baseline model that was then scaled up using the compound scaling method.
What are the features of the 4 Diabetic Retionopathy stages?
There are 4 distinct stages for Diabetic Retinopathy. The various differences are summarized in the following table:
Sure, I’ll add some padding to the table by adding extra spaces. Please note that how the table will appear can also be dependent on the platform or software where it is viewed.
| Grade | Clinical Features | Category |
|---|---|---|
| 0 | No symptoms observed | No Diabetic Retinopathy |
| 1 | Presence of Microaneurysms in one of the four quadrants | Mild NPDR |
| 2 | Microaneurysms, dot and blot Hemorrhages, and cotton wool spots | Moderate NPDR |
| 3 | Intraretinal microvascular abnormalities (in 1 quadrant), Definite venous beading (in 2 quadrants), Intraretinal Hemorrhages (>= 20 in each quadrant), Neovascularization | Severe NPDR |
| 4 | Advanced stage with continual growth of fragile vessels (neovascularization) leading to scar tissue, possibly causing retinal detachment, vision blurriness, and even permanent blindness | Proliferative DR |
Why is automated detection needed for Diabetic Retinopathy?
Diabetic Retinopathy often goes unnoticed in the early stages due to a lack of noticeable symptoms. Automated detection using machine learning models like EfficientNet can help identify this condition in its early stages, allowing for early intervention and treatment, which can prevent irreversible damage and vision loss.
How does Diabetic Retinopathy affect vision?
Diabetic retinopathy is a complication of diabetes that damages the blood vessels in the retina. It often has no early symptoms but can progress to blindness if left untreated. The stages include background retinopathy, pre-proliferative retinopathy, and proliferative retinopathy.
How does the Messidor dataset help train models like EfficientNet?
The Messidor dataset contains images that capture different stages of diabetic retinopathy. This data is used to train models like EfficientNet to classify the severity of retinopathy based on retinal anomalies.
What makes EfficientNet well-suited for medical ML tasks?
EfficientNet balances performance and computational efficiency by scaling network depth, width, and resolution. This allows it to excel at image classification tasks like identifying diabetic retinopathy with limited data and resources.
References
- https://github.com/Nielspace/Custom-NN/blob/main/EffNet/effnet.py
- https://www.sciencedirect.com/science/article/pii/S1319157821001397
- https://www.nhs.uk/conditions/diabetic-retinopathy/
- https://en.wikipedia.org/wiki/Diabetic_retinopathy
- https://en.wikipedia.org/wiki/Neural_architecture_search
- https://www.infoworld.com/article/3648408/what-is-neural-architecture-search.html
- https://arxiv.org/pdf/1704.04861.pdf
- https://towardsdatascience.com/mobilenetv2-inverted-residuals-and-linear-bottlenecks-8a4362f4ffd5
- https://towardsdatascience.com/introduction-to-squeeze-excitation-networks-f22ce3a43348
- https://python.plainenglish.io/implementing-efficientnet-in-pytorch-part-3-mbconv-squeeze-and-excitation-and-more-4ca9fd62d302
- https://amaarora.github.io/2020/08/13/efficientnet.html#inverted-bottleneck-mbconv
- https://arxiv.org/pdf/1905.11946.pdf
- https://analyticsindiamag.com/implementing-efficientnet-a-powerful-convolutional-neural-network/